| Version 8 (modified by , 8 years ago) ( diff ) |
|---|
Physics Modeling and Verification
Neutron Transport and Cross Sections
GUARDYAN uses the cross section data table ENDF/B-VII.1 in ACE (A Compact ENDF) format. Interaction sampling follows similar techniques as in MCNP and OpenMC (OpenMC). Albeit not optimal for GPU applications, we have chosen the already paved way in order to create an easily verifiable code. Major efficiency gain is expected from transforming interaction sampling towards eliminating rejection steps even in exchange for particle weight change: the latter being disadvantageous for the statistical variance the former minimizing thread divergence.
Free path sampling follows the Woodcock (delta-tracking) scheme with energy dependent majorant sampling cross section. The selection of isotope and interaction type happens in the analog way except for choosing between scattering and fission events.
We consider reactions with the following MT numbers: 2, 5, 11, 16, 17, 18, 19, 20, 21, 22, 23, 24, 25, 28, 29, 30, 32, 33, 34, 35, 36, 37, 38, 41, 44, 45, 51-90, 101. After choosing the reaction, the determination of the new energy and angle of the neutron depends on the given ACE law (ACE Laws 3, 4, 7, 9, 11, 44, 61 or 66 ). S($\alpha$, $\beta$) treatment and handling unresolved resonances are not yet included in the physics modeling.
Verification
Verification Methodology
Often a verification of a newly implemented reactor physics code is done in an integral sense, on a near critical assembly with complicated geometry and the estimation of integral parameters like the keff is compared to a well established code calculation result. As GUARDYAN is meant primarily to simulate time evolution of power level and flux we have decided to compare time and energy spectra separately for a broad selection of isotopes. A small subcritical model was also created for validating geometry features and isotope mixture handling.
The verification basic model was a sphere containing a single isotope with density belonging to the natural isotope abundance. Neutrons were started at time zero. In separate calculations 5 starting energies were selected: 10-8, 10-6, 10-3, 1, 18 MeV thereby the interaction types for the full relevant energy range (from thermal up to the energy limit of commonly available cross section data). For each isotope the radius of the sphere was set to three times the free path length at the neutron starting energy. First GUARDYAN was executed and the particles registered at the outer bounding surface of the sphere. Next, using smallest and largest values of energy and time of the GUARDYAN samples a tally bin structure is set up with 24 logarithmic energy bins and 9 equally spaced time bins. MCNP6 input was generated and executed with these tally settings.
The list of isotopes includes every isotope present in ENDF/B-VII.1, except for the metastable ones.
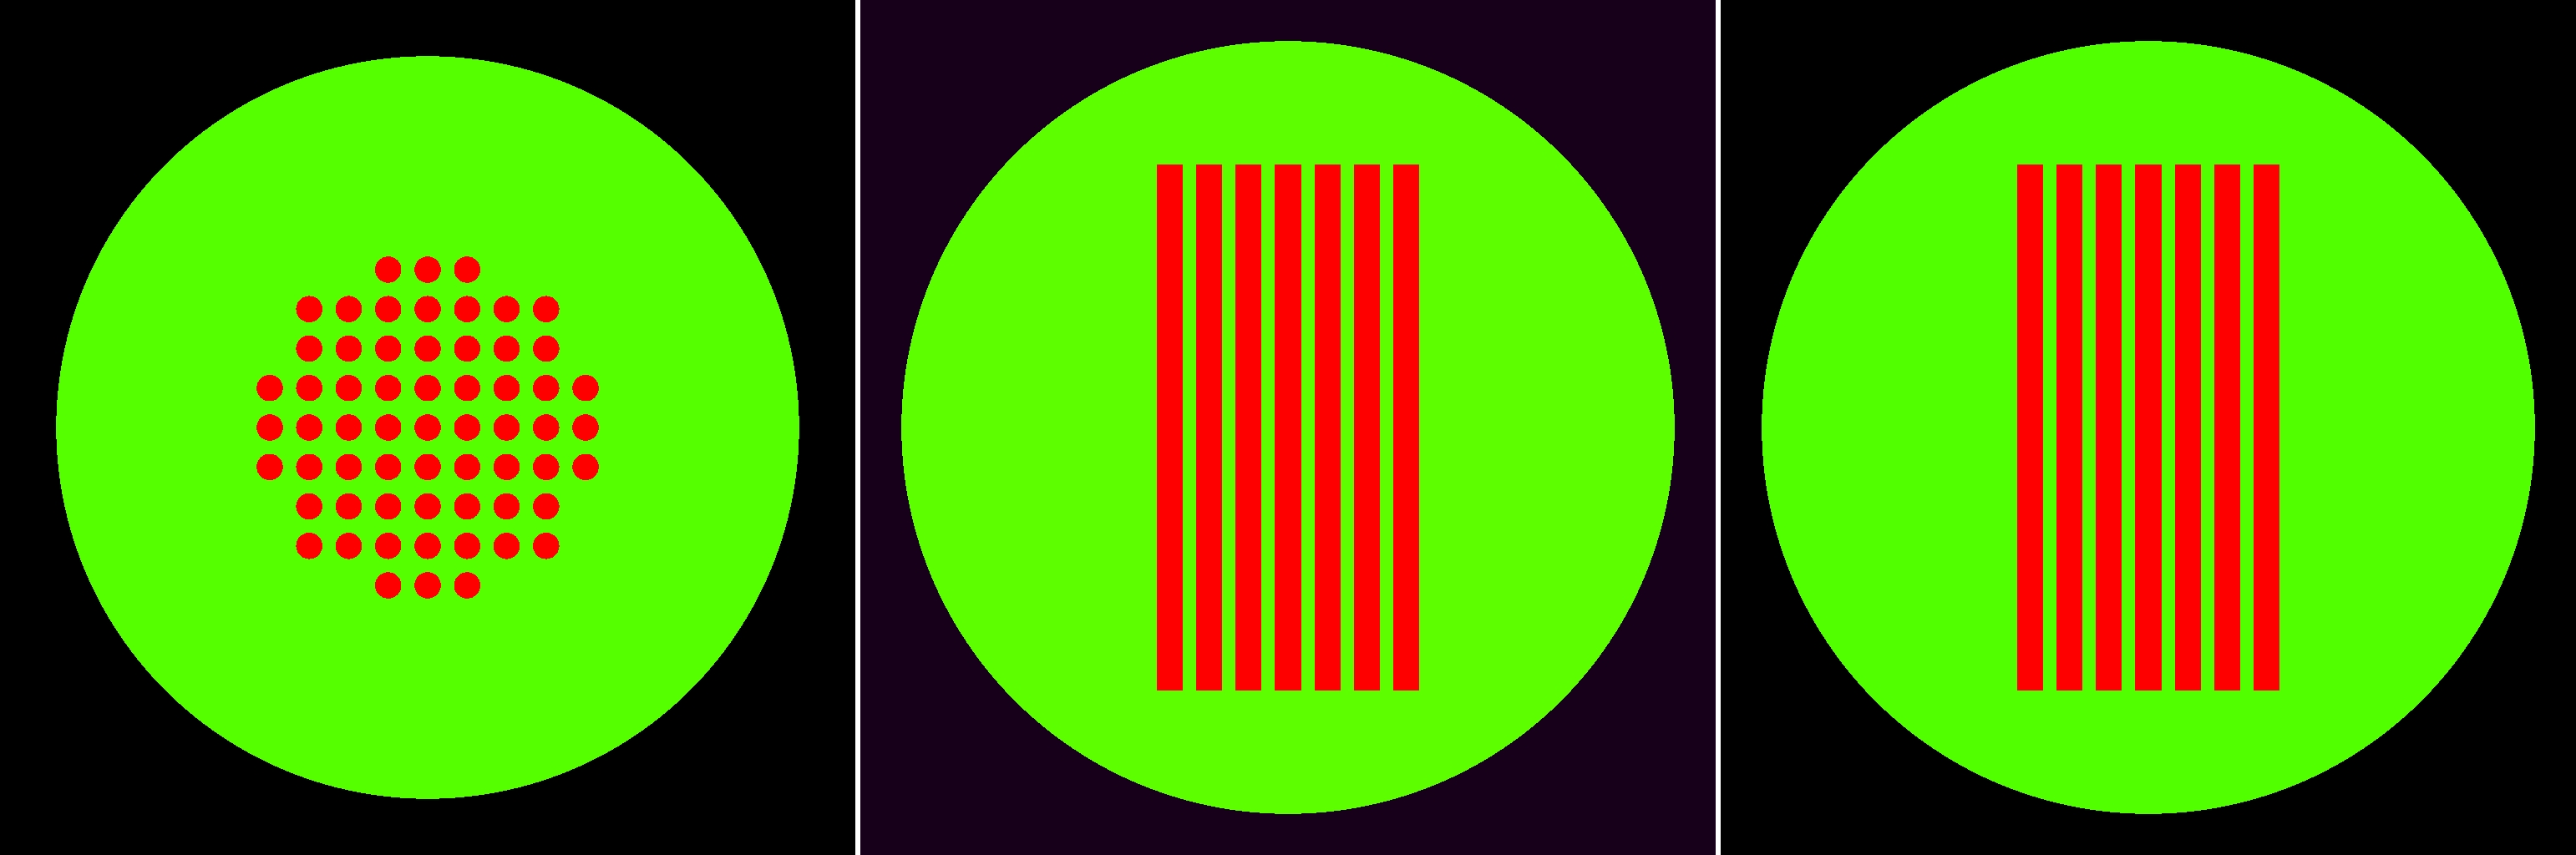
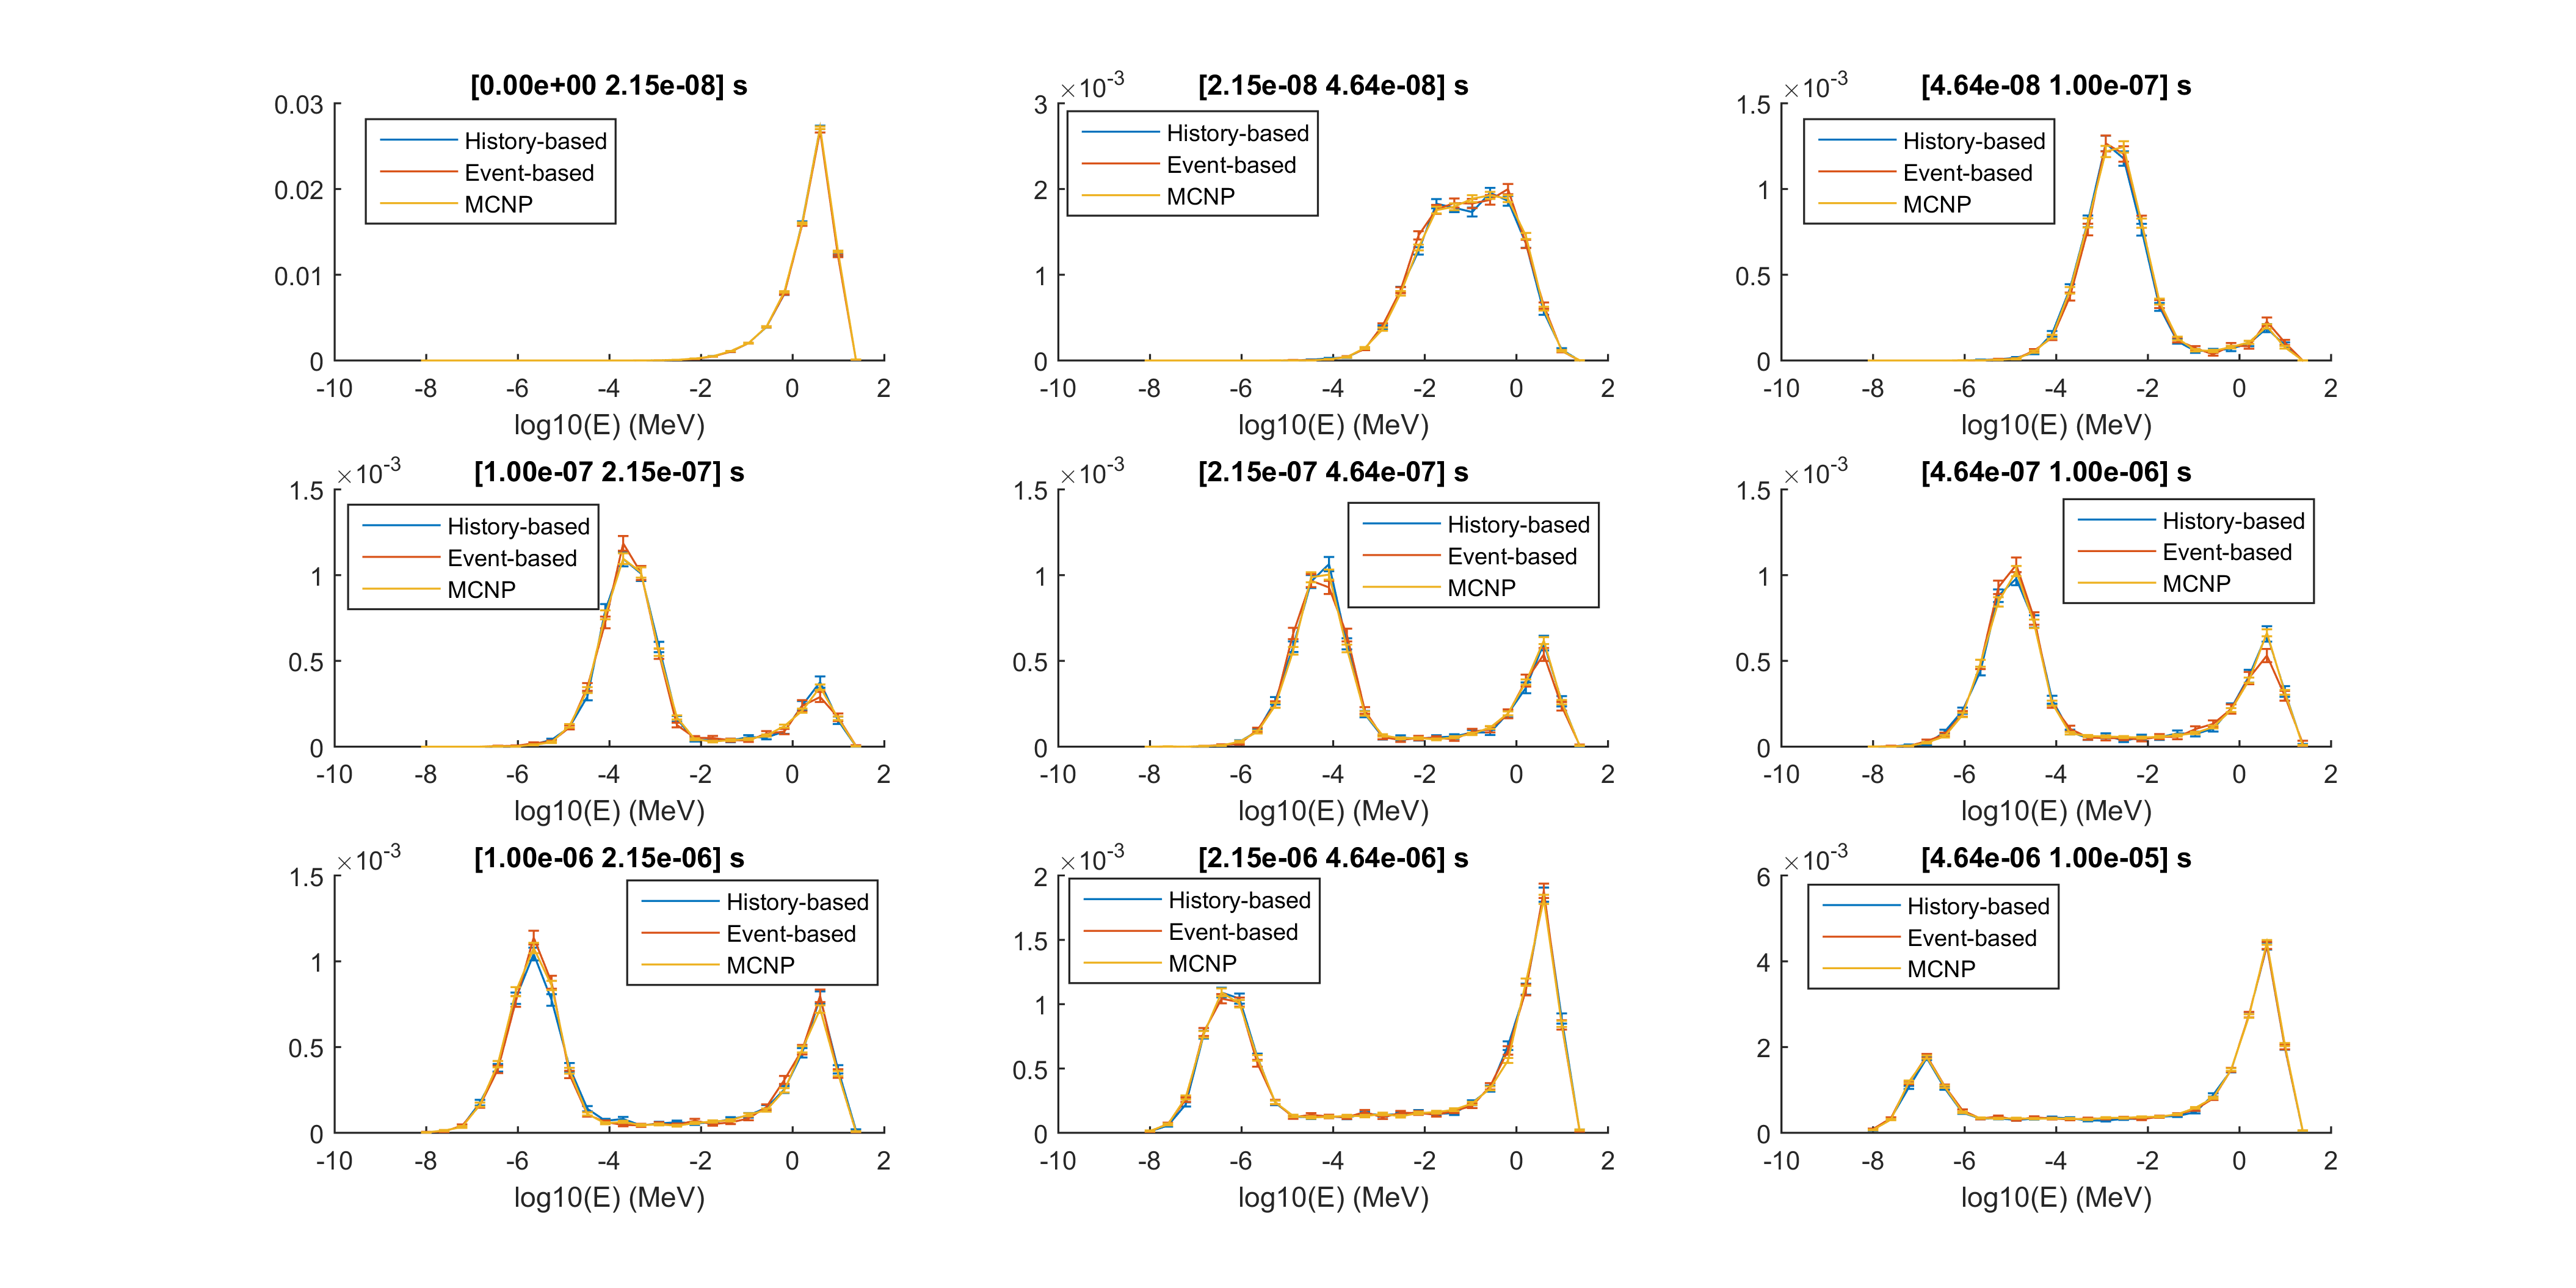
The subcritical model was a 30 cm radius water sphere with 61 UO2 cylindrical fuel rods of 40 cm length, 1 cm radius spaced 1 cm apart from each other see Fig. 1.. Uranium was 4.7% enriched and fuel rod density was taken as 10.5g/cm3.

Figure 1.: Geometry of the subcritical verification model
Similarly, a time-energy spectrum is registered in this case as well.
Verification Results
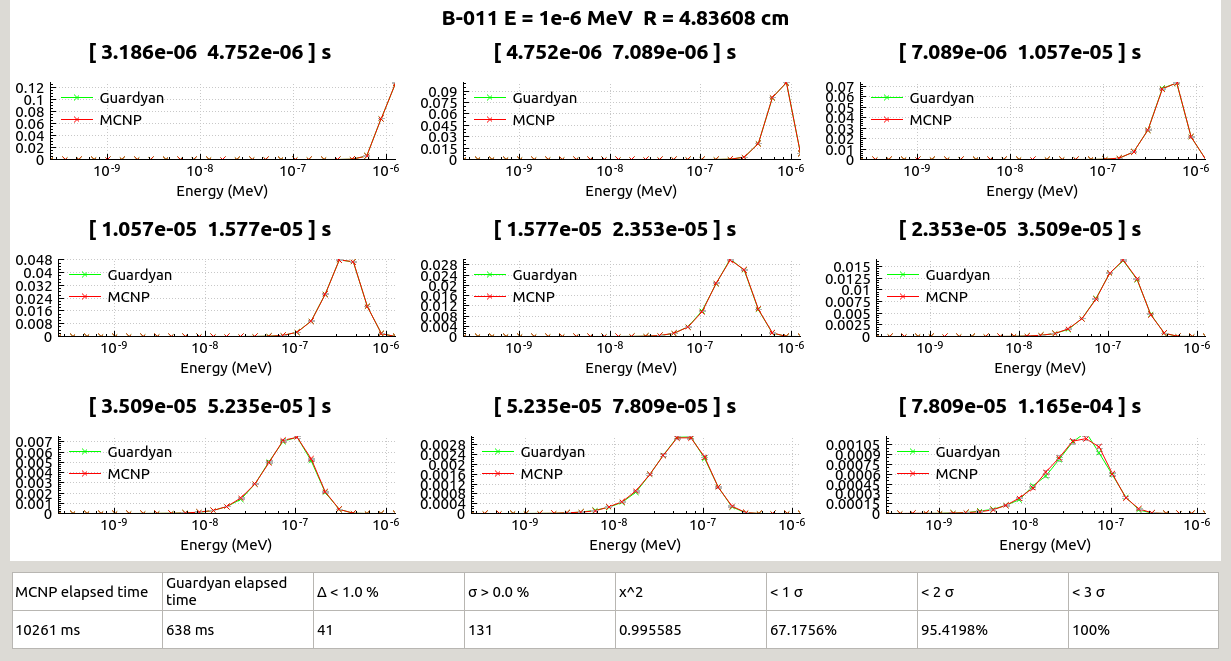
For each isotope a figure has been created for visual inspection see Fig. 2. Separate figures are energy spectra of the number of particles crossing the sphere outer surface divided by the starting particle number, each figure belongs to a separate time interval.

Figure 2.: Example of Time-Energy Spectra comparison graphs for 11Be, 10-6 MeV
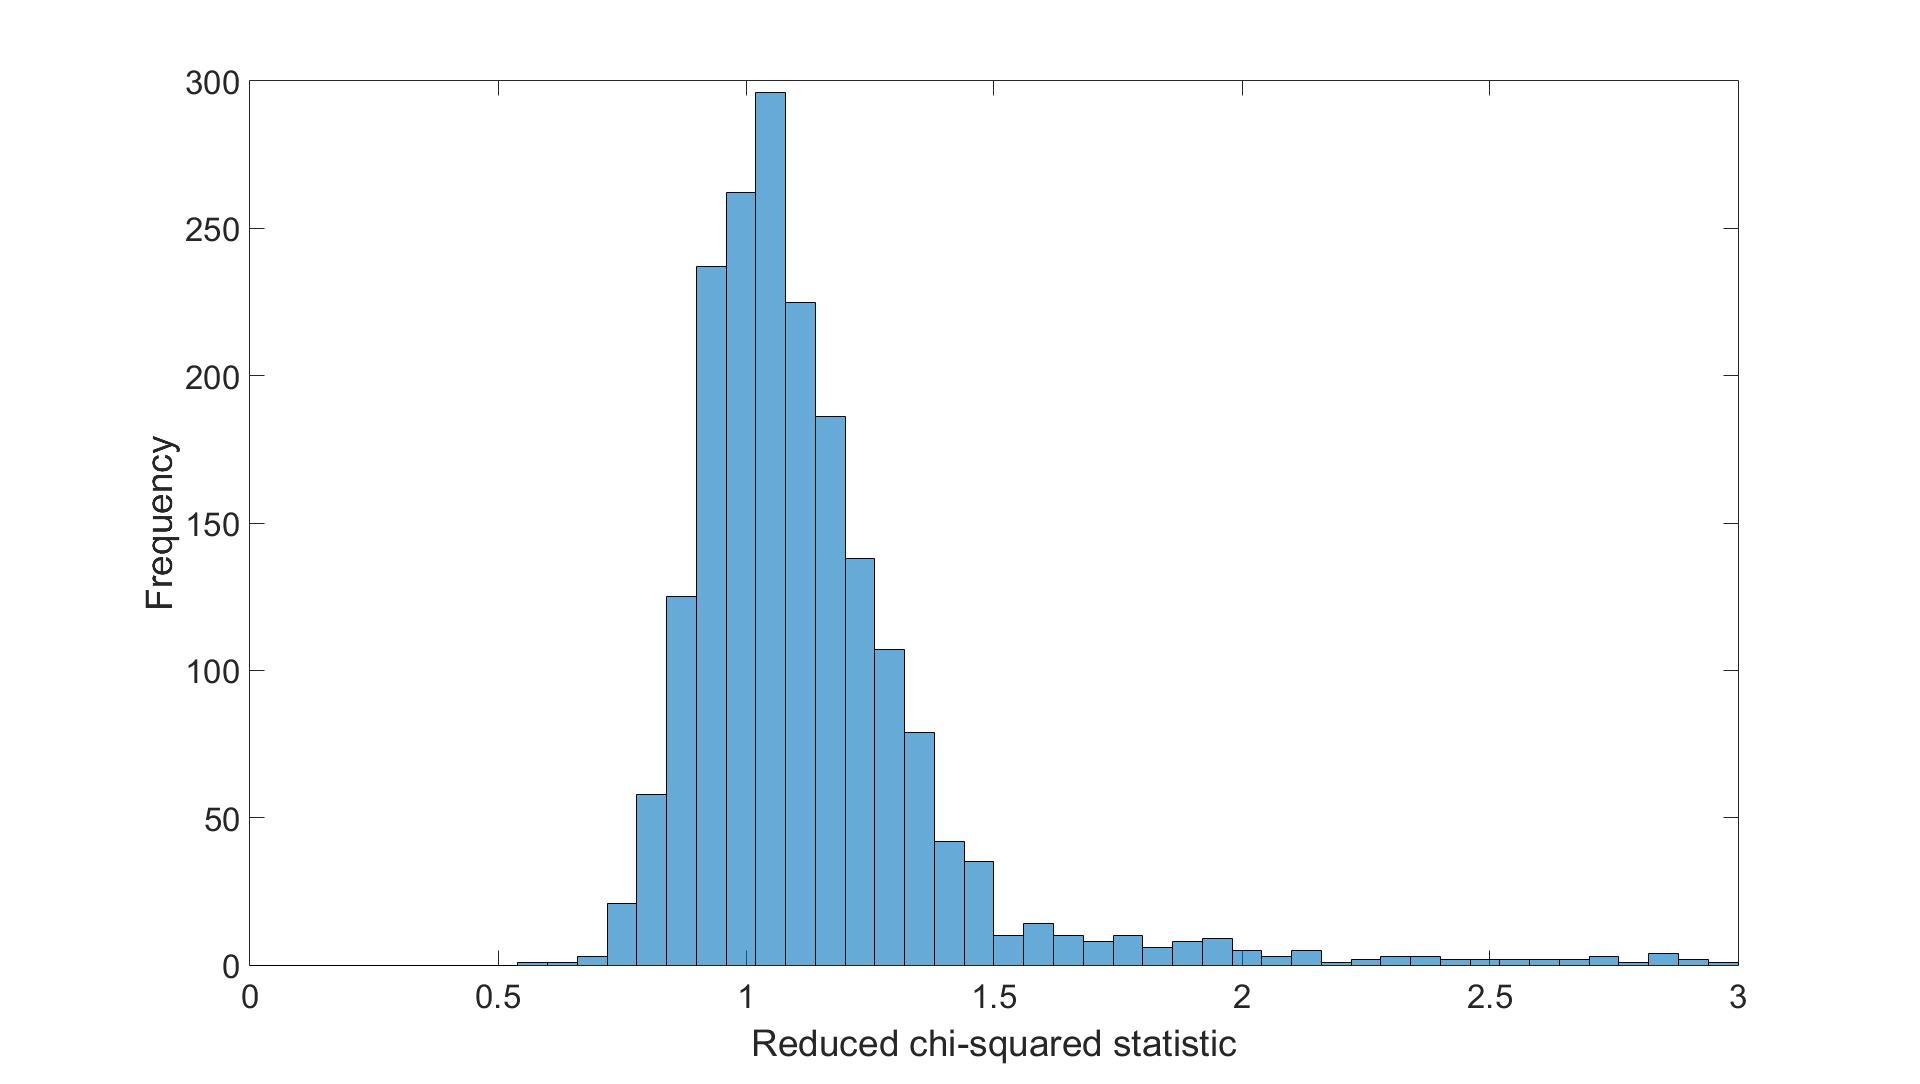
As a result a total of some 445 000 data points were compared at the final stage. A reduced $\chi$2 -like statistics was calculated as:
$\chi {2}=\frac{1}{N}\sum_{i=1}{N}\frac{(y_{MCNP,i}-y_{GUARDYAN,i}){2}}{\sigma_{MCNP,i}{2}-\sigma_{GUARDYAN,i}{2}}$
where N is the number of i data points for a single isotope a single starting energy (i.e. N= 9x 24 = 216 ), $\sigma$ stands for the standard deviation of the Monte Carlo estimates and y is the tally results. It means that squared difference is compared against the sum of squared standard deviations, thus $\chi$2 should be below 1 is if the results fall within 1 standard deviation, in most cases it should be below 2 and results above 3 should be rare.

Attachments (5)
- NRDI.jpg (34.8 KB ) - added by 8 years ago.
- UOH2O_geometry.png (246.7 KB ) - added by 8 years ago.
- B-011_1e-6MeV.png (114.9 KB ) - added by 8 years ago.
- chi_square_histogram.jpg (74.0 KB ) - added by 8 years ago.
- UOH2O_mcnp_vs_guardyan.png (399.2 KB ) - added by 8 years ago.
Download all attachments as: .zip