Examples
GUARDYAN is capable of simulating neutron transport in complex geometries, but is has yet to be further developed in order to provide quantitative results fit for intercomparisons with other codes. Here we only provide some illustrations for the capabilities regarding neutron transport, time evolution and the geometrical complexity.
BME Training Reactor
The pool-type nuclear reactor of the Budapest University of Technology is in operation since 1971. The core is built of EK-10 fuel assemblies with 10% enrichment. The maximum thermal power is 100 kW, the maximum thermal neutron fluence is 2.7•1012 n/cm2s. The main purpose of the facility is to support education in nuclear engineering and physics; however, extensive research work is carried out as well. Neutron and gamma irradiation can be performed using 20 vertical irradiation channels, 5 horizontal beam tubes, two pneumatic rabbit systems and a large irradiation tunnel. The facility has physical and radiochemical laboratories and a hot cell too.
The geometry model was input to Guardyan and a neutron transport calculation was initiated from a homogeneously distributed neutron source using 226 neutrons. Fig. 1 shows the photograph of the core in operation, the model geometry and a snapshot of the neutron population. On the geometry model figure the light blue indicates the position of the fuel pins, light green stands for water and dark blue is for the reflector.
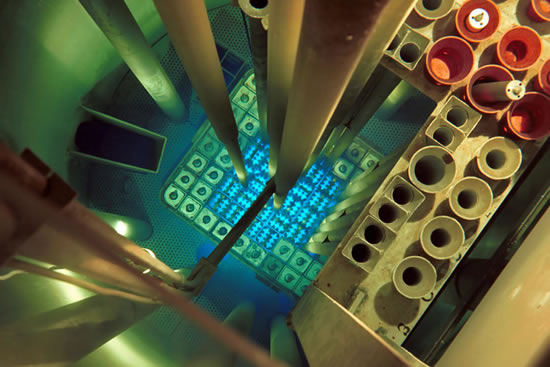
BME Training Reactor Image of the Core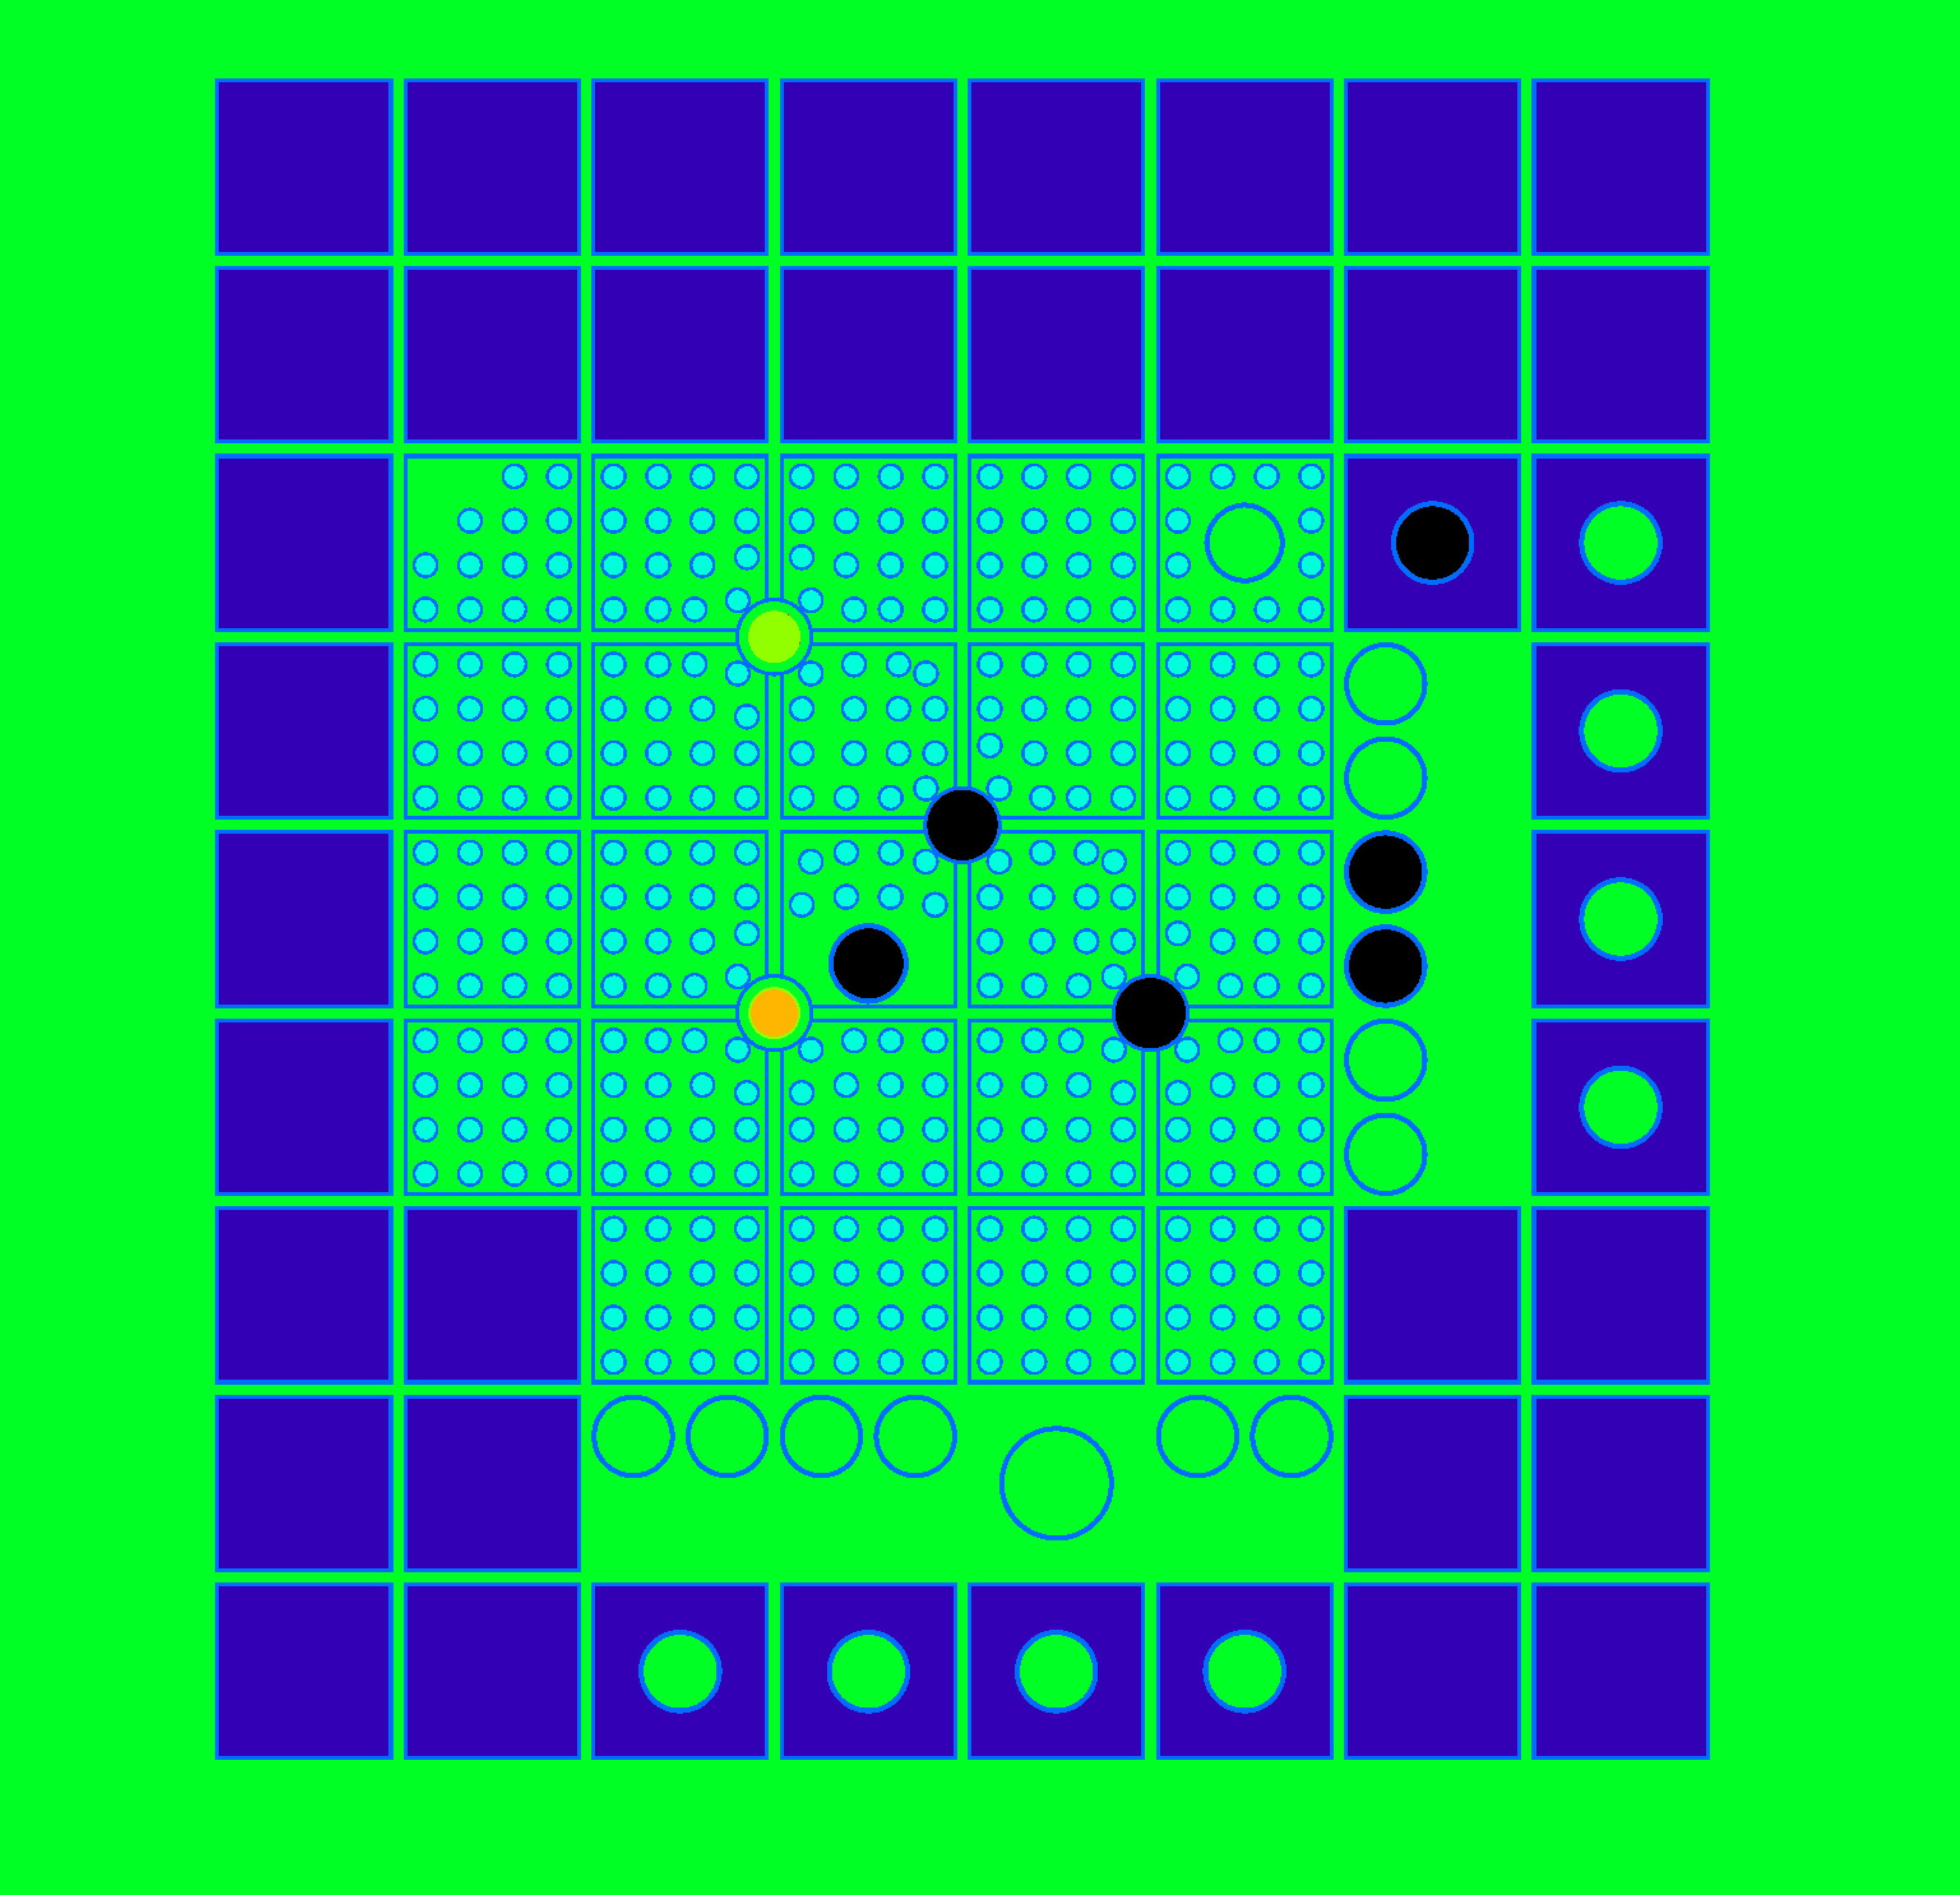
BME Training Reactor Geometry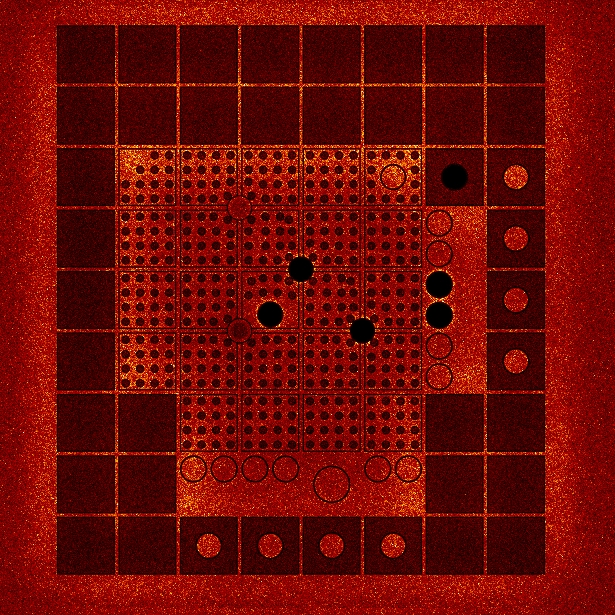
Neutron density distribution in the BME Training reactor calculated by GUARDYAN
Figure 1.: BME Training Reactor image of the core, model geometry and simulated neutron density
The right-hand-side image of the neutron population is a snapshot of particles after exactly 10-6 seconds. Most of the neutrons are in the water due to their lower speeds. Note that the geometry image is not superimposed here, the material changes are only visible in accordance with the neutron population change. Fig. 2 shows the distribution of fission positions happening in the firs 10-3 seconds.
Figure 2.: BME Training Reactor Fission source distribution in 10-3 sec
As a further illustration, an impulse point source was introduced to the BME Training Reactor at the middle of the geometry at critical state with initial energy 0.01 MeV, see Fig. 3.. First the fast source neutrons start populating the middle of the geometry (until about 10-7s). Afterwards the thermalized neutrons start building up the fission source and slowly the whole reactor will be populated by neutrons. The simulation video frame rate increases tenfold at 10-7s due to the vastly different time scale of the fast and the thermal processes. Note tat the whole video duration is within a single generation time.
Figure 3.: BME Training Reactor neutron density evolution as a response to an impulse point source
Time evolution in a subcritical assembly
The subcritical model was a 30 cm radius water sphere with 61 UO2 cylindrical fuel rods of 40 cm length, 1 cm radius spaced 1 cm apart from each other, see Fig. 4.. Uranium was 4.7% enriched and fuel rod density was taken as 10.5g/cm3.
Figure 4.: Geometry of the subcritical model
At time zero a point source emitted neutrons in the middle of the geometry with 10MeV energy. Afterwards the time evolution of the neutrons were followed. Results in terms of fission distribution along the cross secion of the geometry are shown in Fig.5
 |
Figure 5.: Time evolution of the fission source
VVER-440 a Geometry input check
For checking the memory requirements of realistic geometries, we have created the full model of a VVER-440 (similar to the ones operating at PAKS NPP) core including the pressure vessel. Some geometry cross sections can be found in Figures 6 and 7.
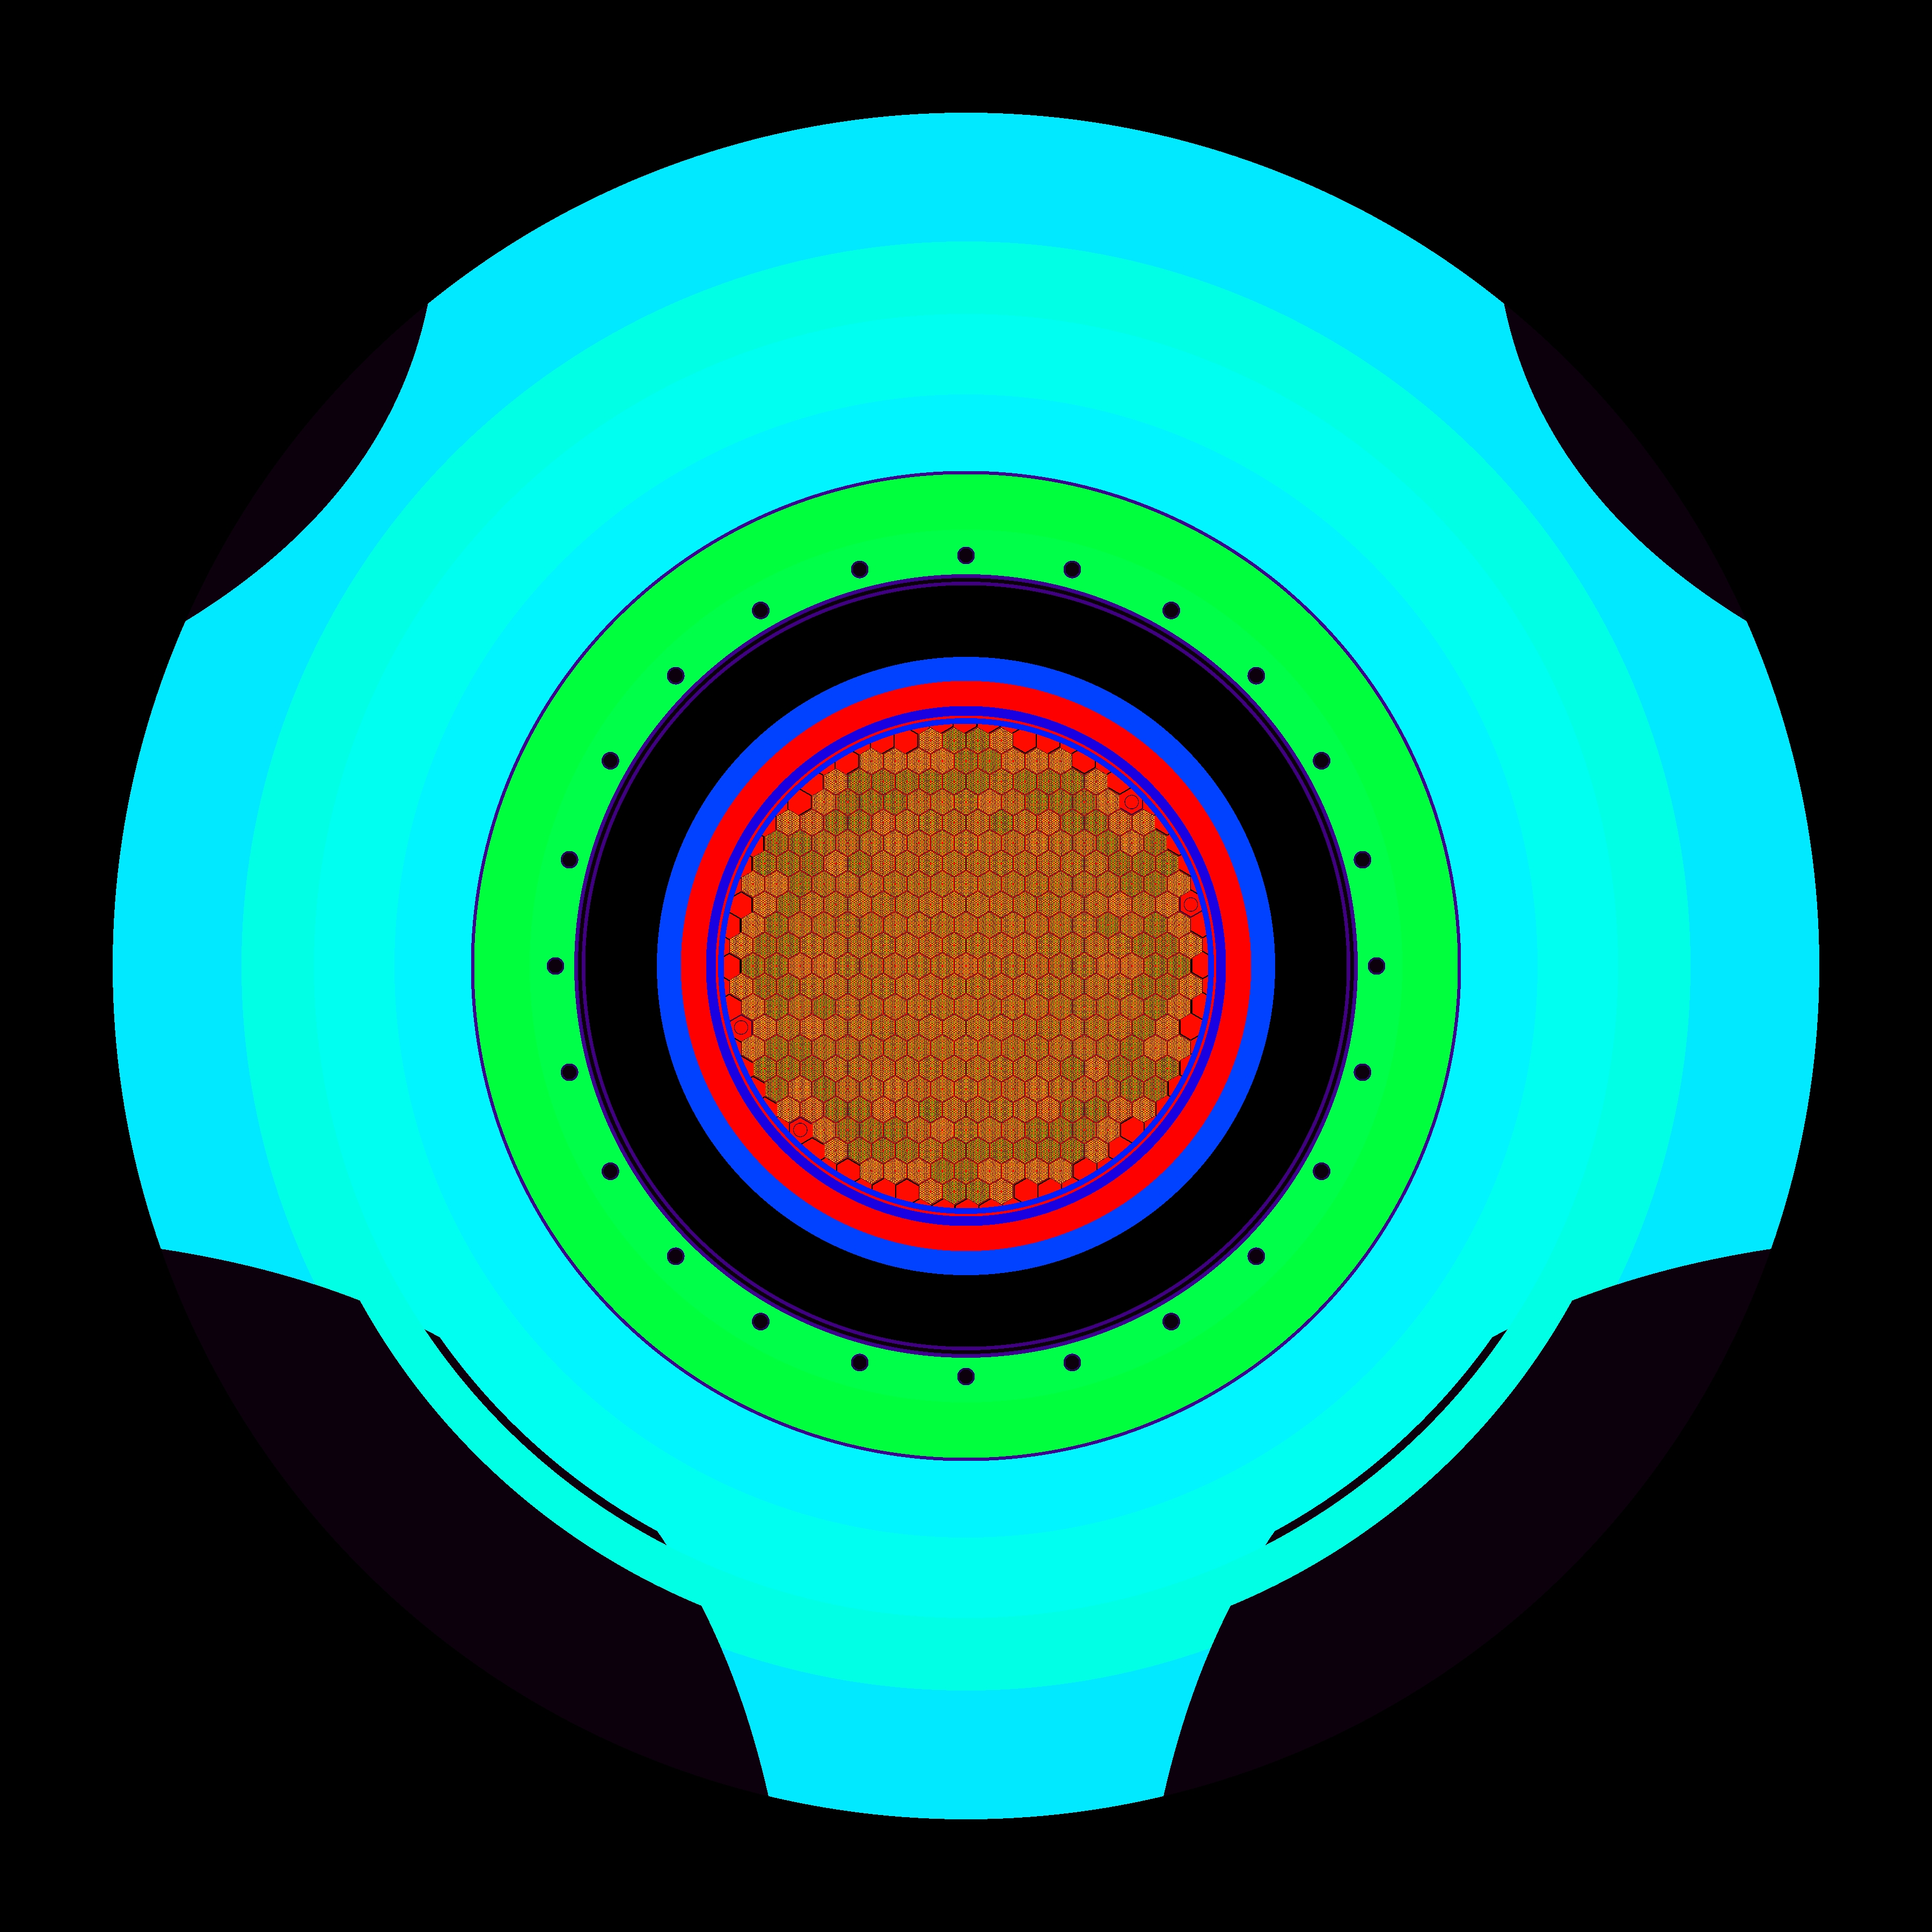 VVER-440 core cross section | 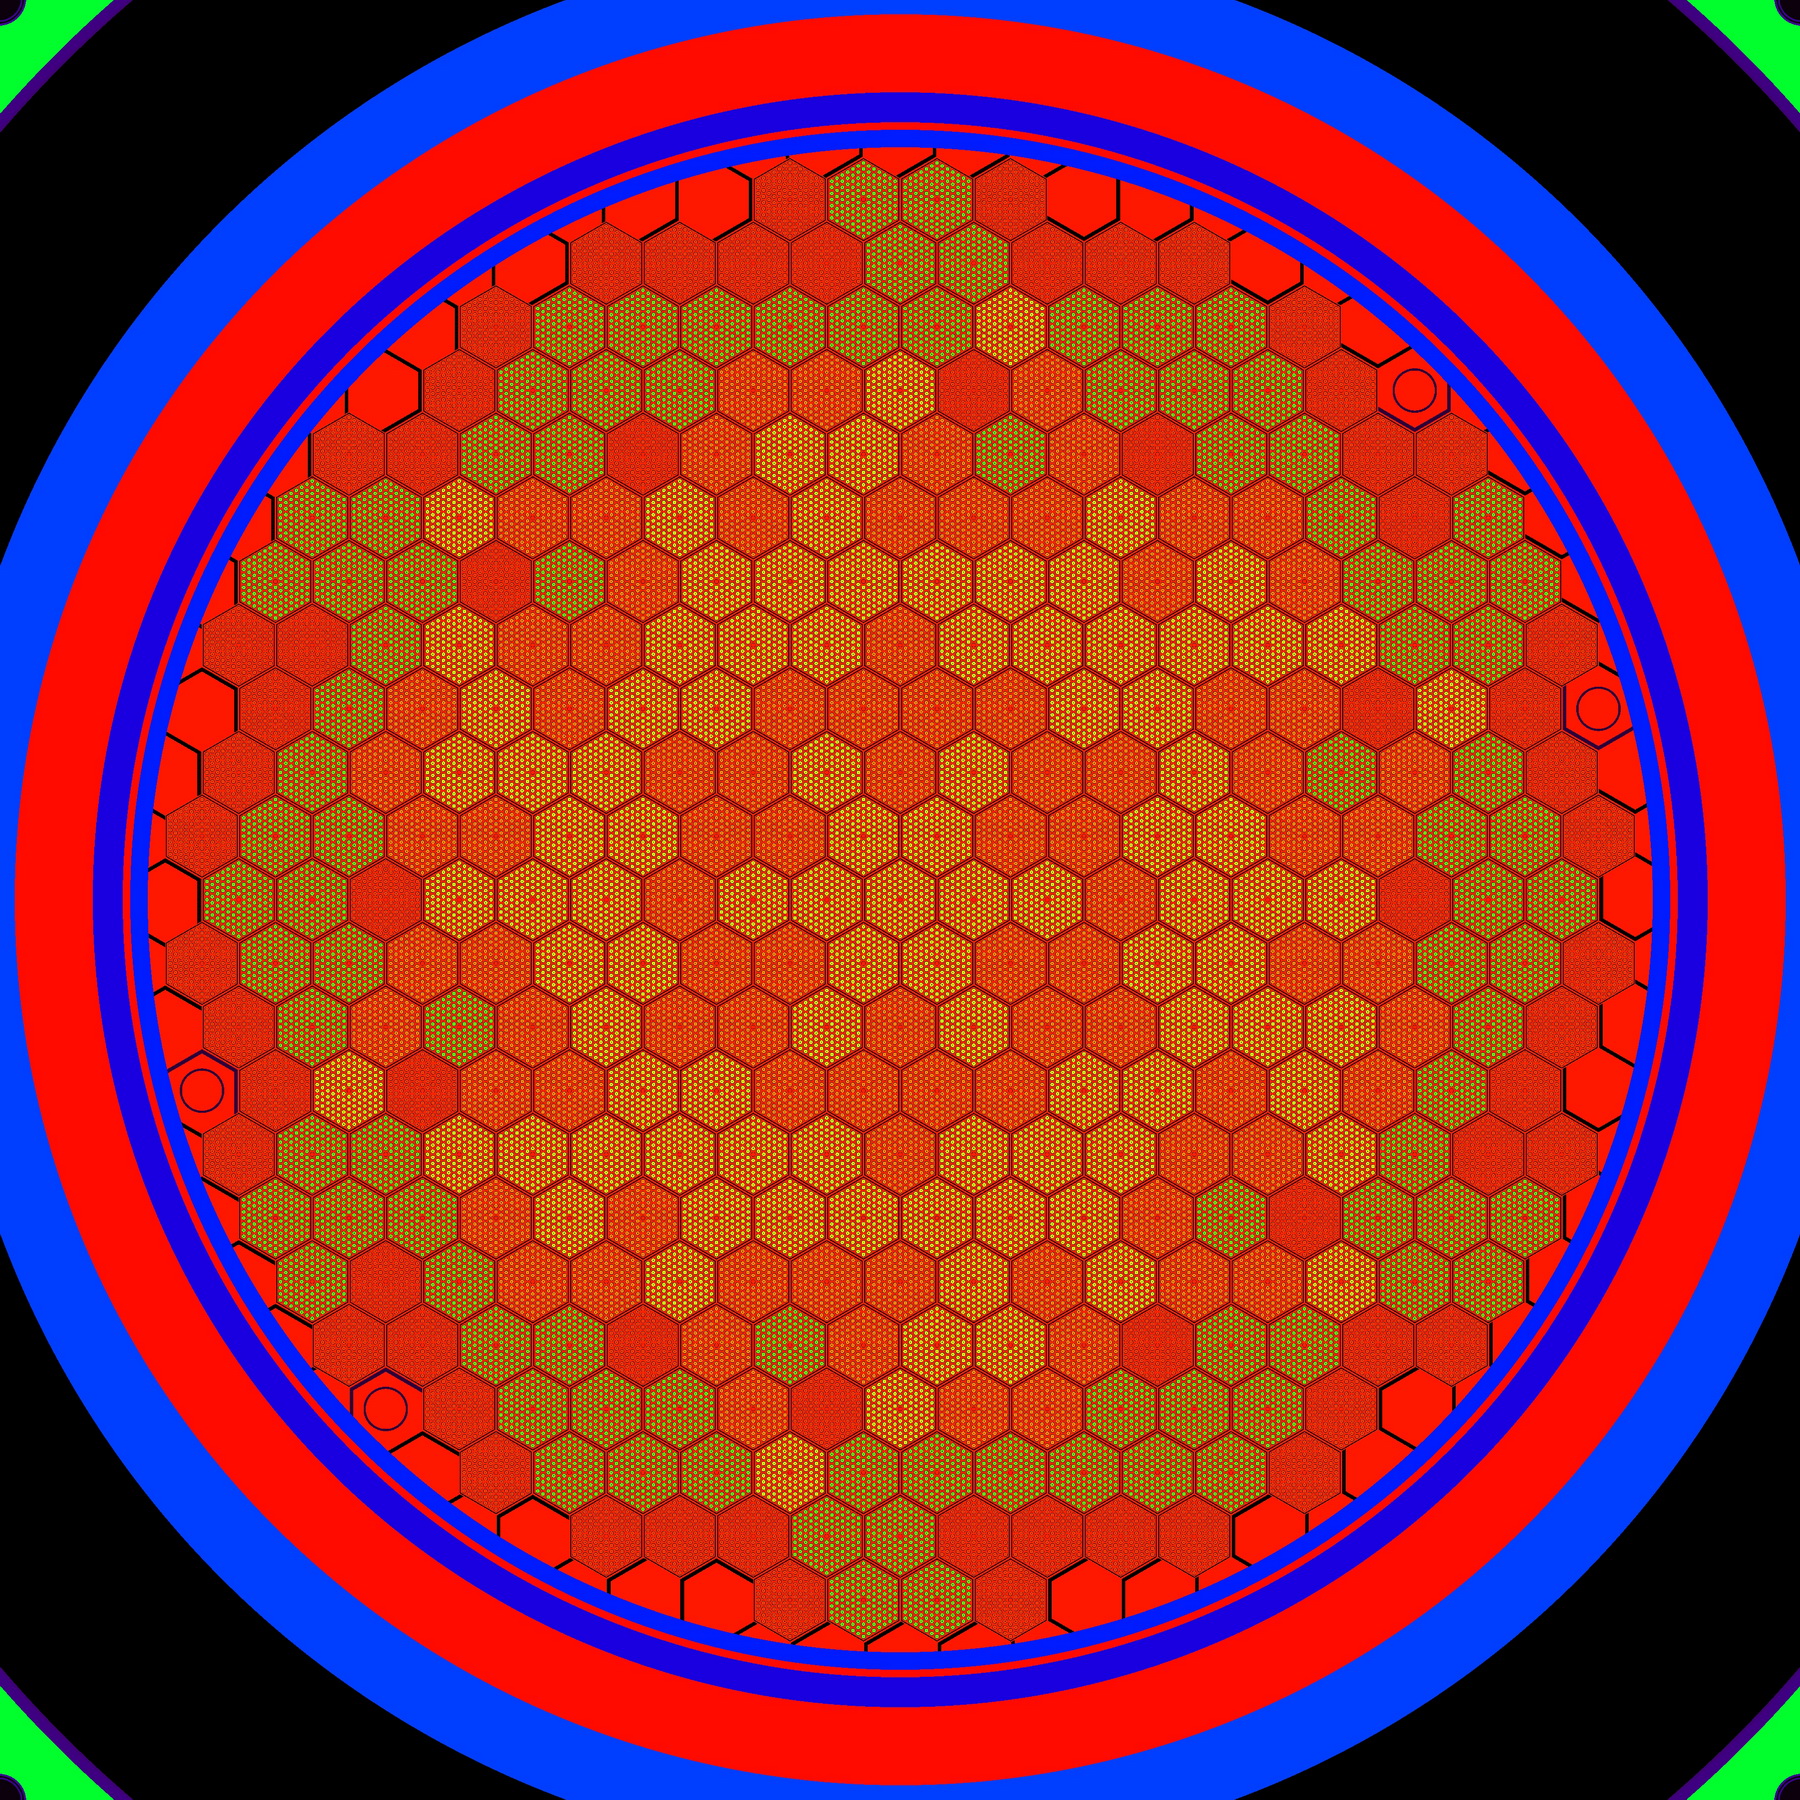 VVER-440 core cross section zoomed in | 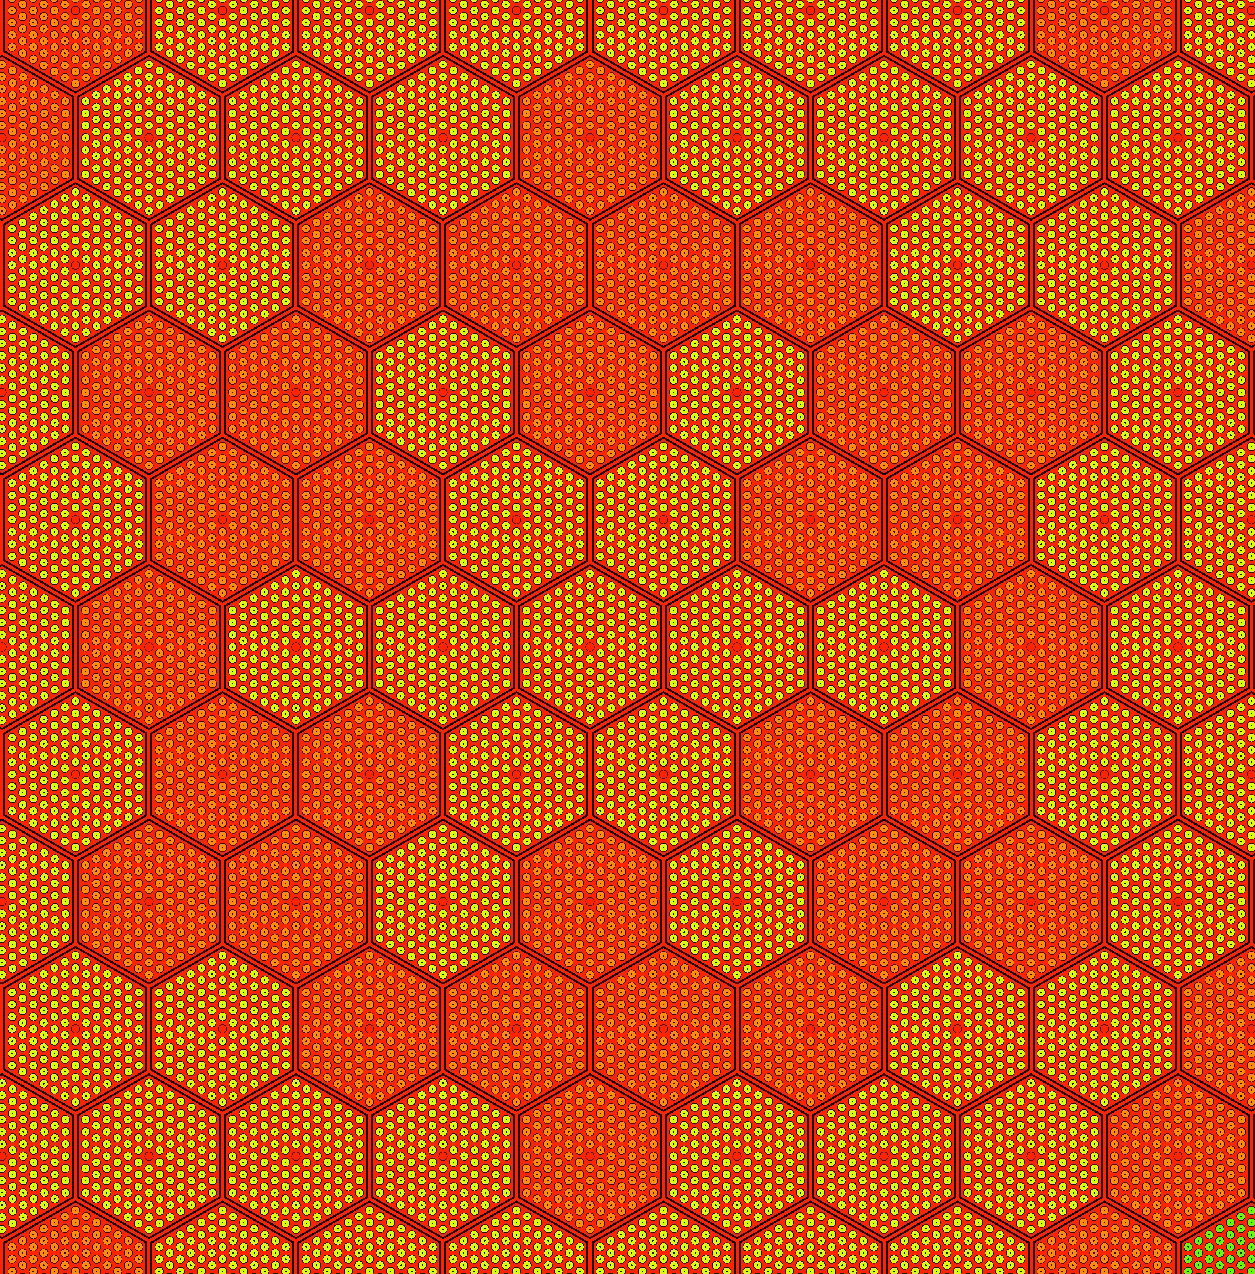 VVER-440 core cross section zoomed in even more |
Figure 6.: VVER-440 geometries in GUARDYAN
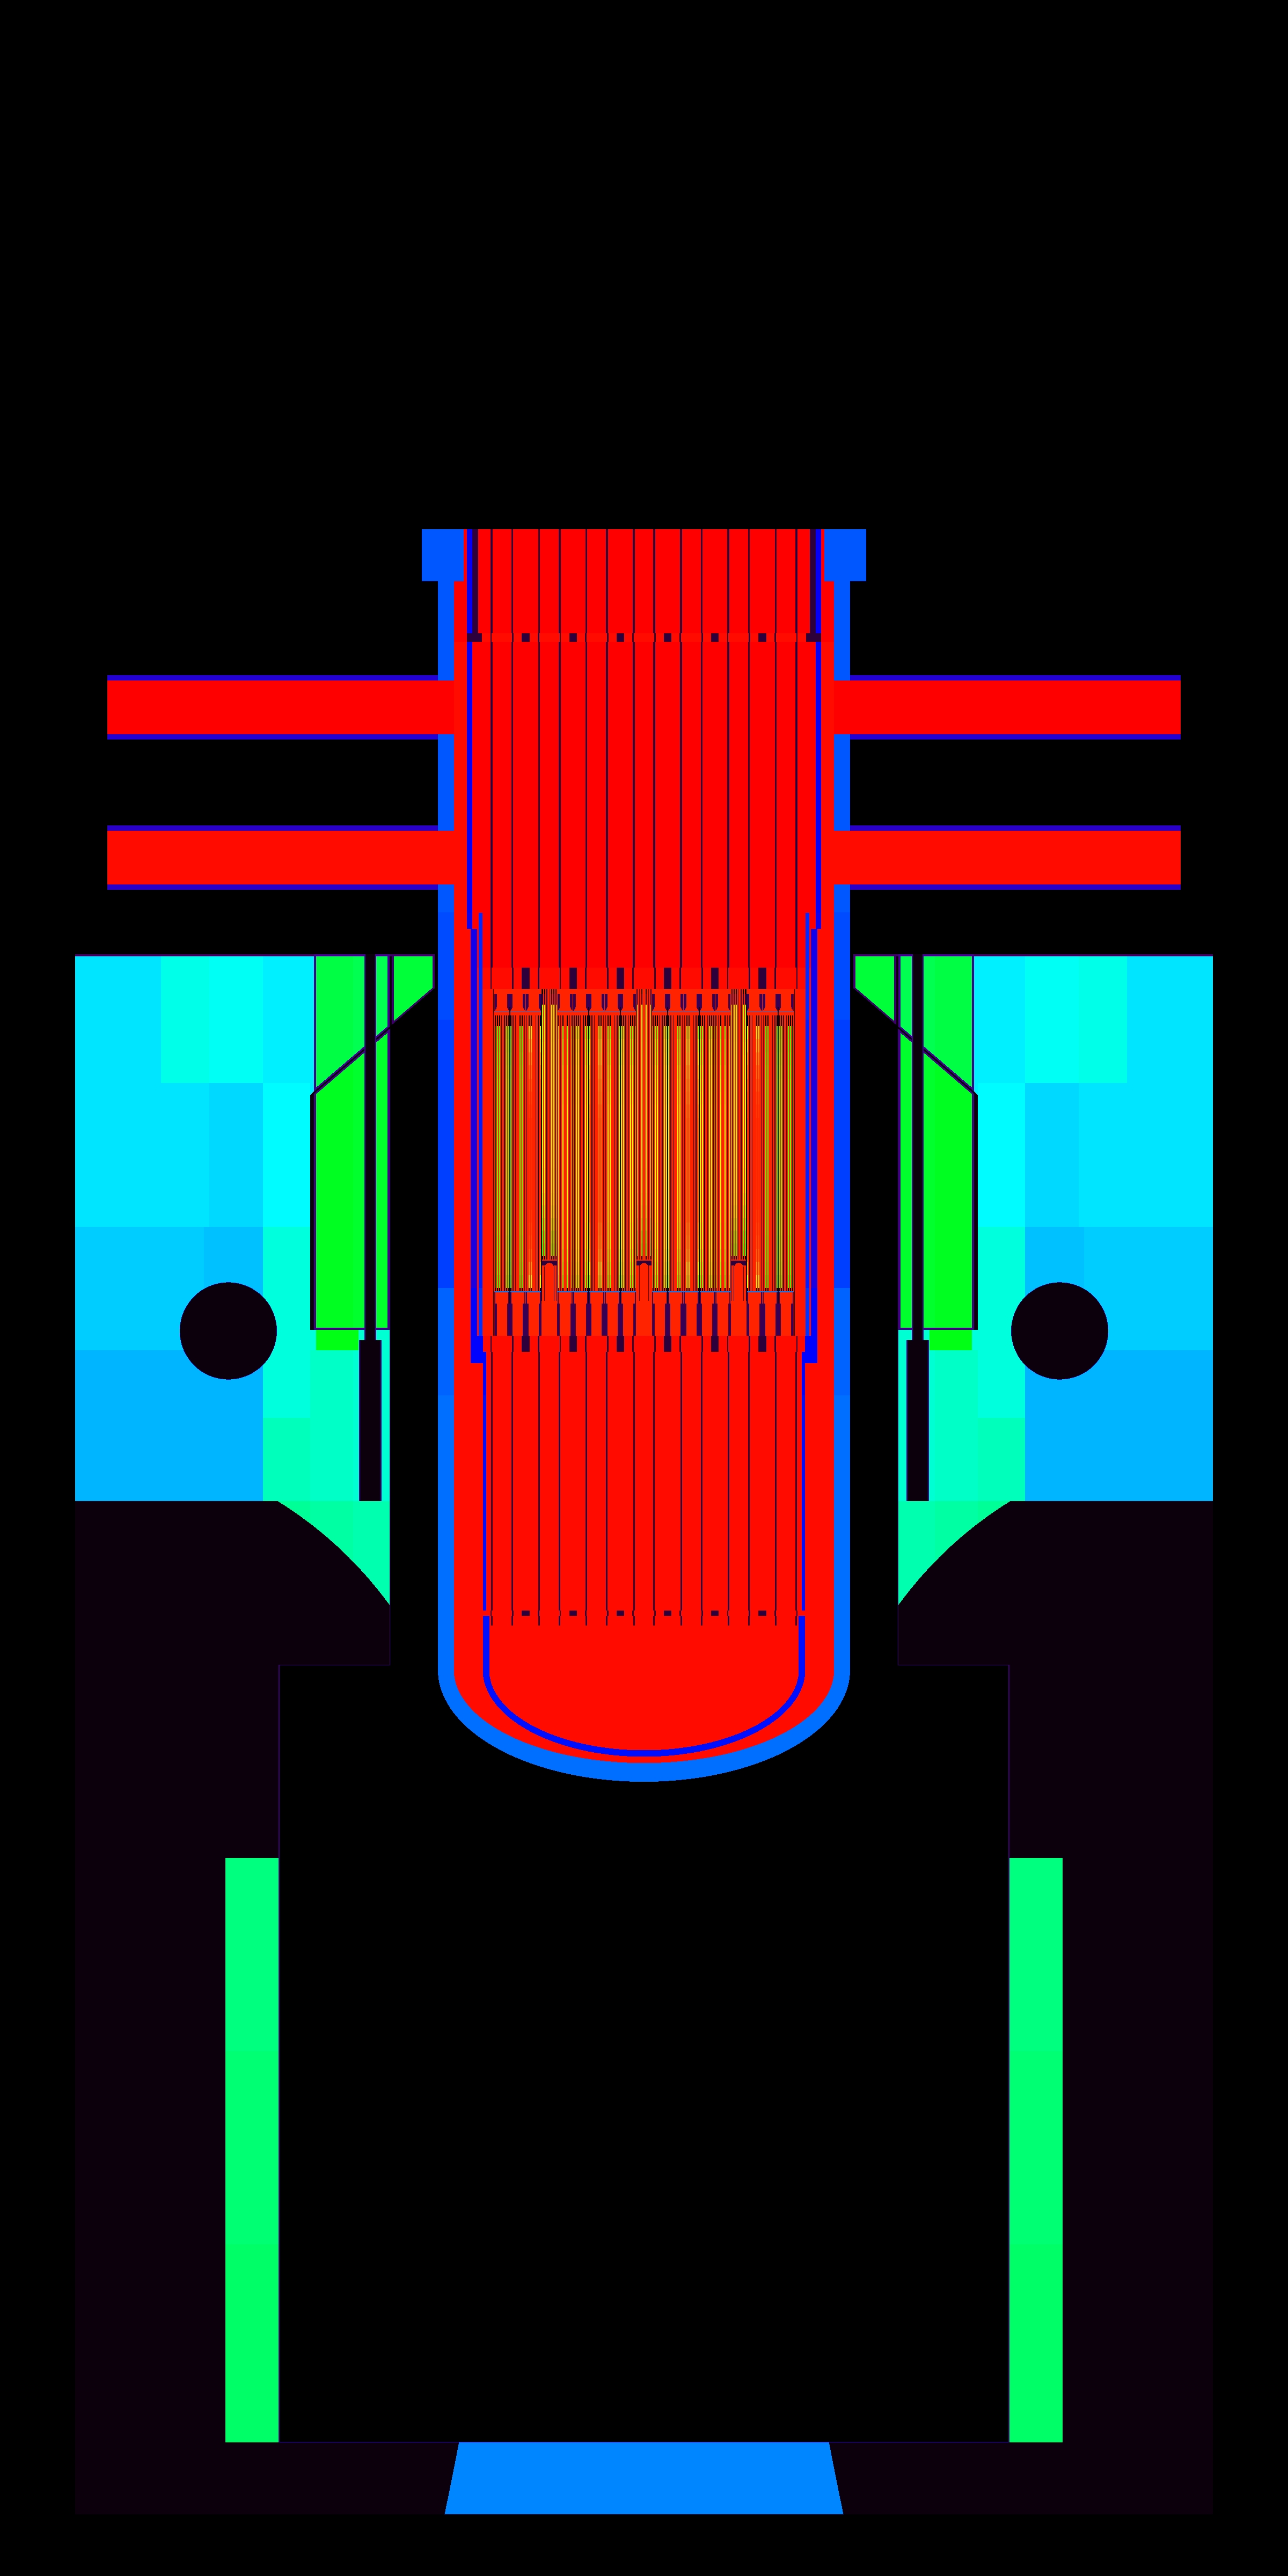 Figure 7.: VVER-440 geometry in GUARDYAN | Figure 8.: PAKS NPP neutron density evolution as a response to an impulse point source |
TMI 3x3 Minicore Benchmark Video
| Figure 9.: TMI 3x3 MInicore Benchmark |
Attachments (11)
- BMEOR_v3.jpg (1.2 MB ) - added by 8 years ago.
- BME_OR_1e-6s_n2e26_neutrondensity_Guardyan_v3.jpg (528.0 KB ) - added by 8 years ago.
- BME_TR.jpg (49.5 KB ) - added by 8 years ago.
- UOH2O_geometry.png (246.7 KB ) - added by 8 years ago.
- BMEOR_fissions_95e-5_1e-3s.png (615.5 KB ) - added by 8 years ago.
- UO_H2O_rods_16timestep_z-sum_cropped.png (174.6 KB ) - added by 8 years ago.
- material_volume_coronal_6.jpg (845.2 KB ) - added by 8 years ago.
- material_volume_transverse_4_resize.jpg (1.9 MB ) - added by 8 years ago.
- material_volume_transverse_4_middle_crop.jpg (1.8 MB ) - added by 8 years ago.
- material_volume_transverse_5.jpg (2.3 MB ) - added by 8 years ago.
- NRDI.jpg (34.8 KB ) - added by 8 years ago.


